Submission
Input forms
TCRmodel server can be used to model the unbound TCR structure and TCR structure in complex with peptide-MHC structures. Both Class I and Class II MHC complexes are supported. The main server page has three sections:
- TCR-pMHCI complex modeling
- TCR-pMHCII complex modeling
- Unbound TCR modeling
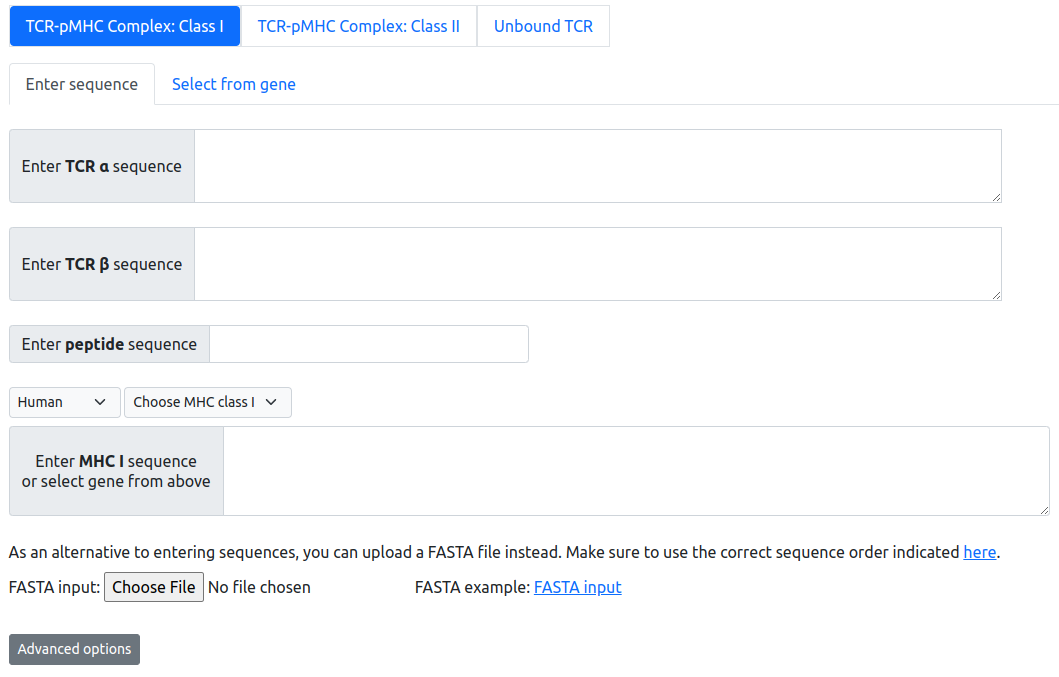
Input forms: TCR-pMHC complex modeling
Users can provide the input for the TCR-pMHC complex modeling in three ways:
- Enter the sequence in the text box
- Select the germline gene from dropdown menu
- Upload a FASTA file
The peptide sequence input needs to fulfill the length requirement. For Class I peptides, the length of the peptide can range from 8-13 (inclusive), excluding 12. For Class II peptides, the length of the input peptide should be greater than or equal to 9. Our modeling algorithm will first trim the Class II to 9 amino acid "core" peptide sequences. Only the core peptide of class II will be modeled. Our server will trim user-input MHC sequence to alpha 1 & alpha 2 domains for class I MHCs, and alpha 1 & alpha 2 domains for class II, prior to modeling.
Input forms: Unbound TCR modeling
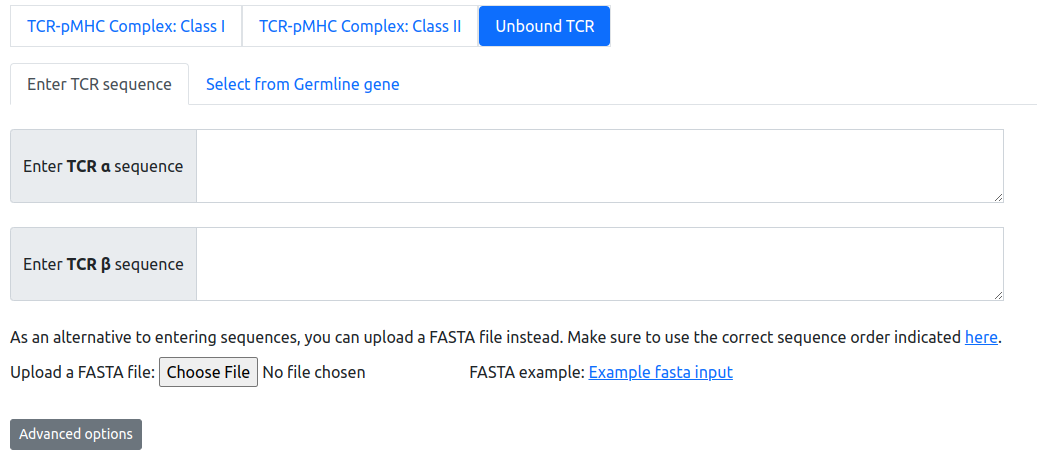
TCR sequences for modeling can be submitted as amino acid sequences for alpha and beta chains, encompassing at minimum the TCR variable domains. The TCRmodel server will automatically identify germline genes in the input sequences, if there is an exact match in the database.
Upload a fasta file

Users can opt for uploading a multiple FASTA file instead of filling the sequence fields manually. The FASTA file must contain the TCR:pMHC sequences in the following order:
- For TCR-pMHCI complex
- TCRα
- TCRβ
- peptide
- MHCα
- For TCR-pMHCII complex
- TCRα
- TCRβ
- peptide
- MHCα
- MHCβ
- For Unbound TCR
- TCRα
- TCRβ
Despite we provide a suggestion for the FASTA headers names in example files, we don’t require any convention.
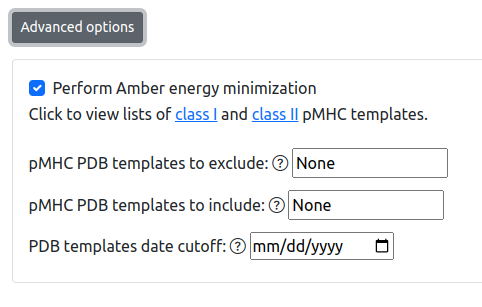
Advanced options
Results
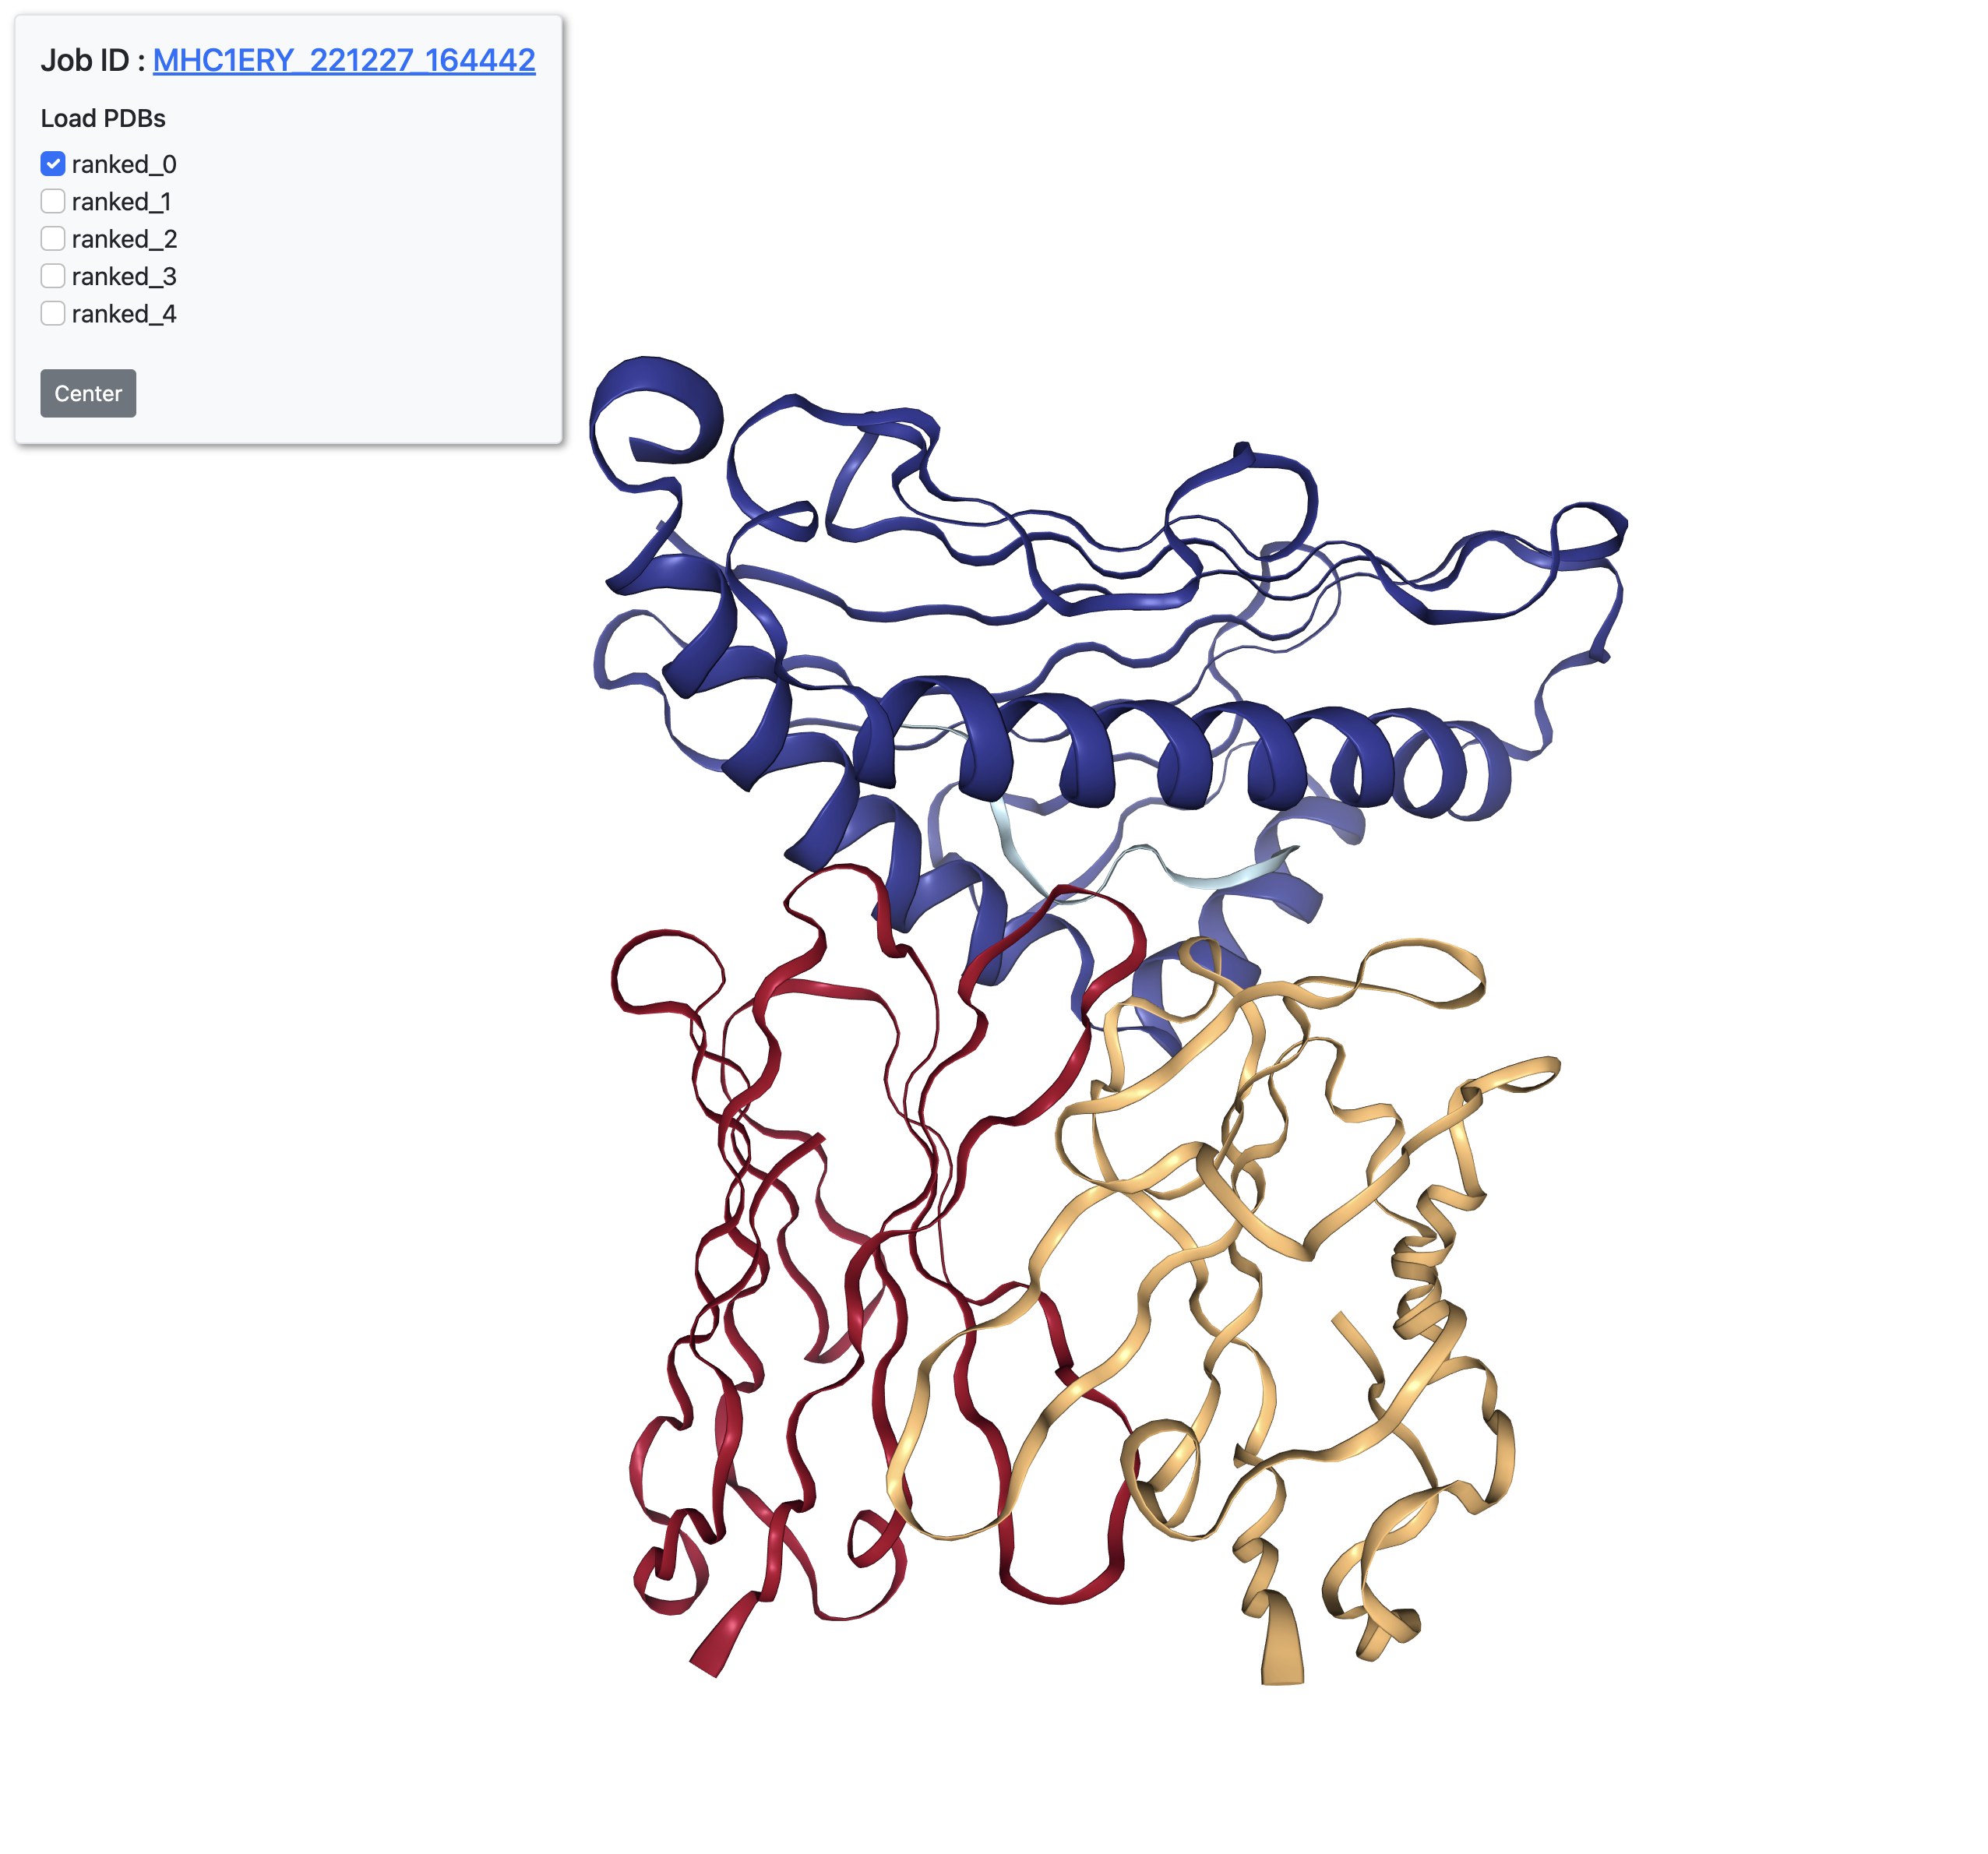
Output model & viewer
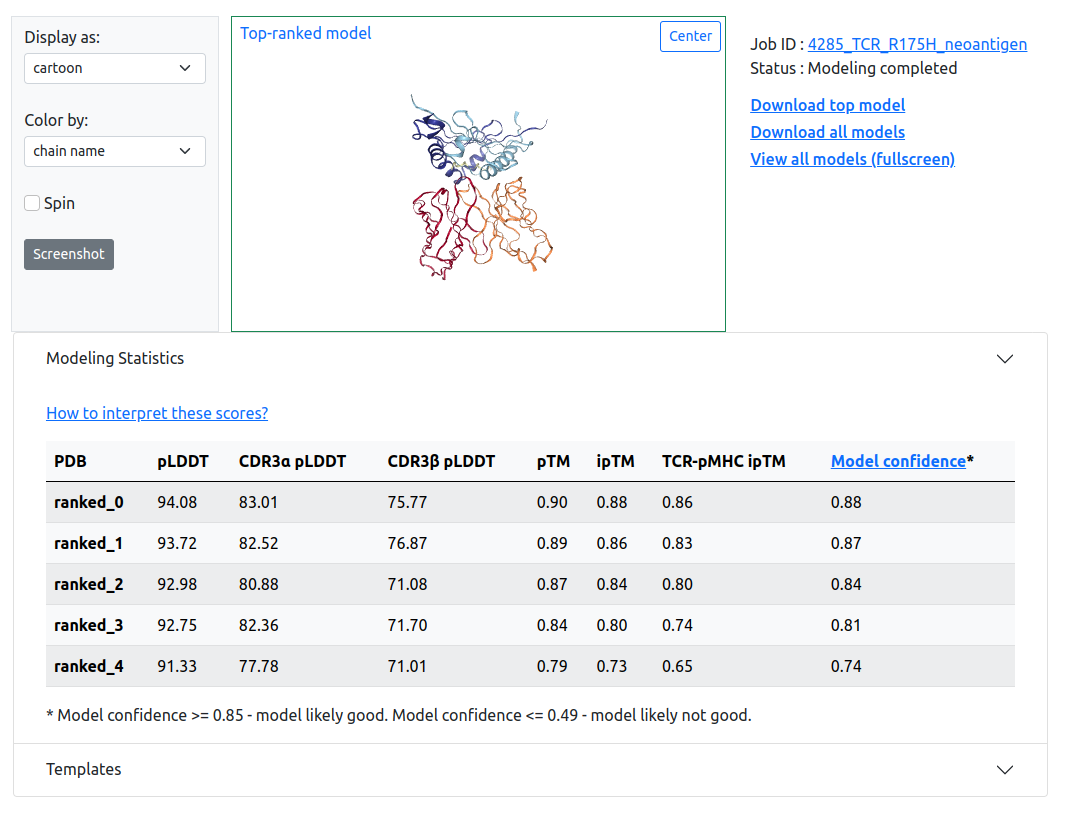
Five models are generated. They are ranked in the order of "model confidence" from AlphaFold-Multimer (iptm+ptm). After modeling finishes, the result page includes an interactive viewer showing the top-ranked modeled TCR or TCRpMHC structure, and downloadable model coordinates for top-ranked or all predictions.
Modeling statistics
Modeling statistics are diplayed in the collapsible table under the viewer port. Confidence measurements provided by AlphaFold, including predicted local difference distance test (pLDDT), predicted TM-score (pTM), interface pTM score (ipTM), and model confidence are shown for all predictions. If the target is a TCR-pMHC complex, we provide a modified version of ipTM and pLDDT score, TCR-pMHC ipTM and I-pLDDT. The meaning of these scores are provided below:
- pLDDT, ranging from 0-100, is indicative of local structural accuracy
- pTM, ranging from 0-1, is indicative of overall topological accuracy
- ipTM, ranging from 0-1, is a topological accuracy assessment of the interface between all chains.
- TCR-pMHC ipTM, ranging from 0-1, is an assessment of topological accuracy measurement of interface between the TCR and pMHC
- I-pLDDT, ranging from 0-100, is the average pLDDT of TCR-pMHC interface residues within a 4 Å distance cutoff
- model confidence, ranging from 0-1, is a weighted summation of pTM and ipTM scores
For all of the confidence measurements displayed, higher values correspond to higher confidence.
Model confidence
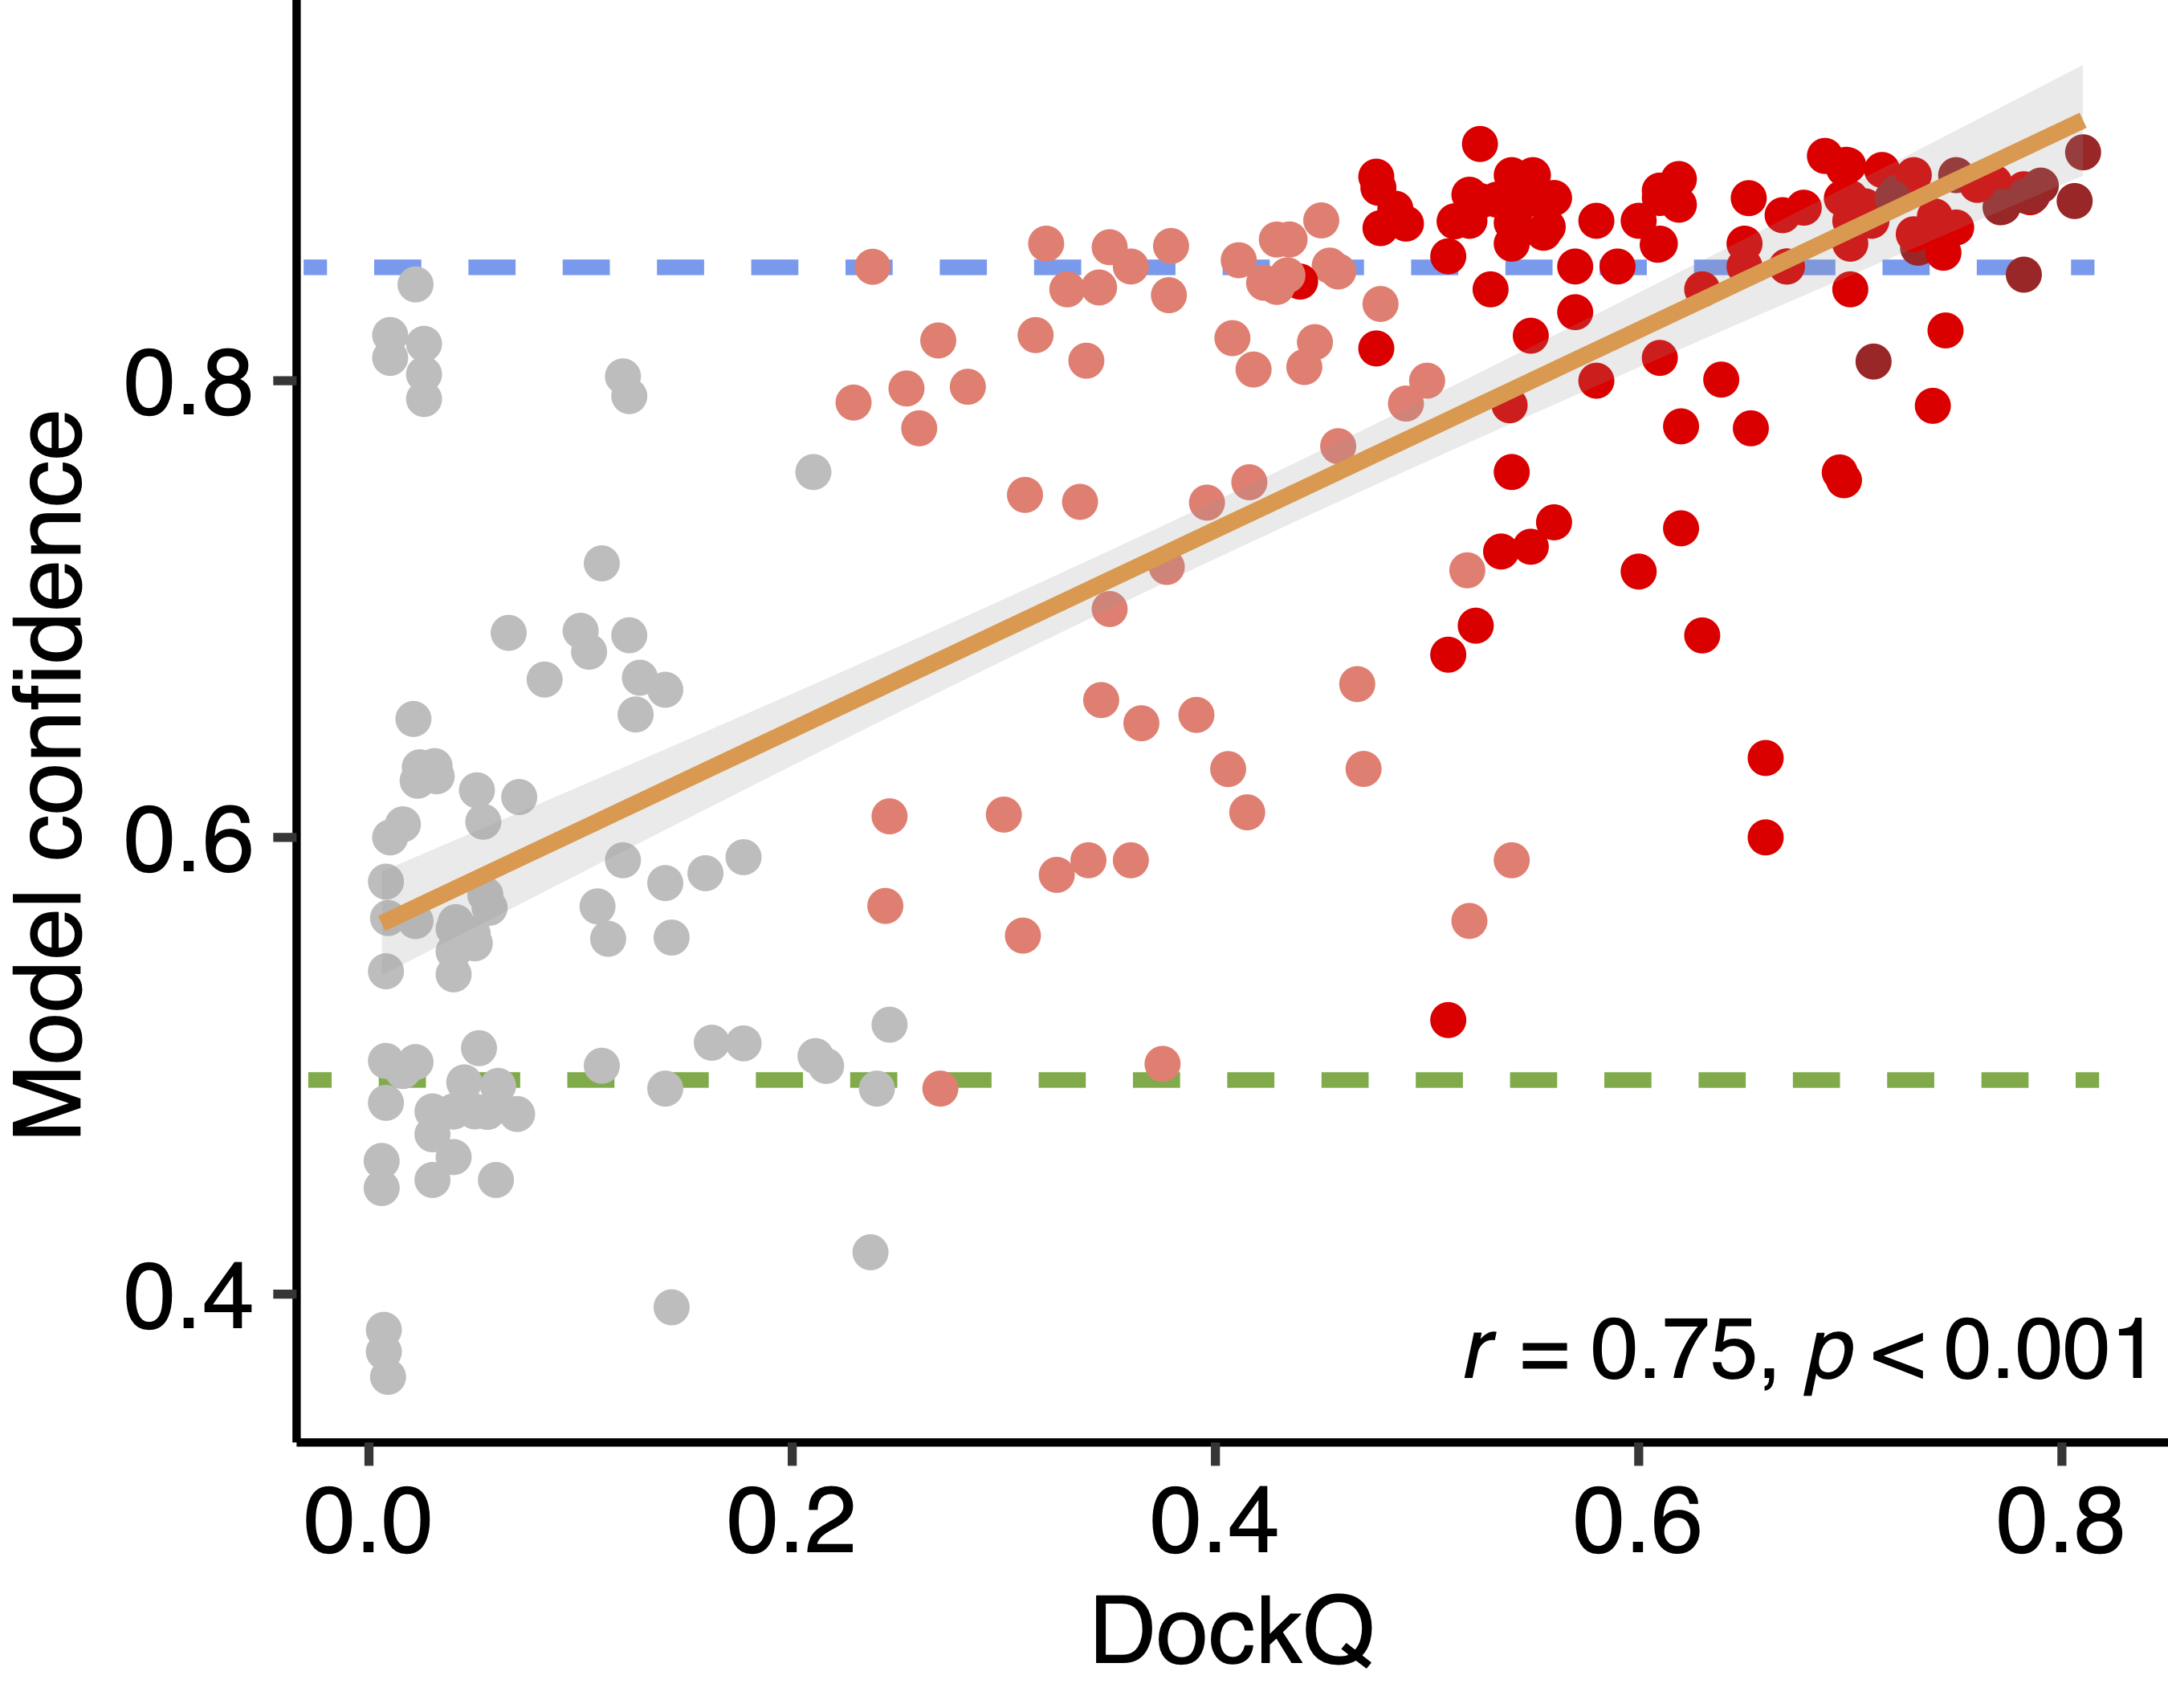
To provide guidance on model confidence interpretation, we show a scatter plot on the right hand side, displaying the relationship between model confidence (y-axis) and model quality assessed by DockQ score (x-axis), from our benchmarking test on 48 non-redundant TCR-pMHC complexes. Five models were generated for each TCR-pMHC complex test case, and are shown as datapoints on the scatter plot. These datapoints are colored by CAPRI accuracy criteria. Based on our benchmarking, we find that:
- models with model confidence >= 0.85 are likely good - the majority of models with model confidence at or above 0.85 (see blue dashed line on the scatter plot) are Medium or High accuracy by CAPRI criteria.
- models with model confidence <= 0.49 are likely not good - most models with model confidence below 0.49 (see green dashed line on the scatter plot) are Incorrect by CAPRI criteria.
Template information
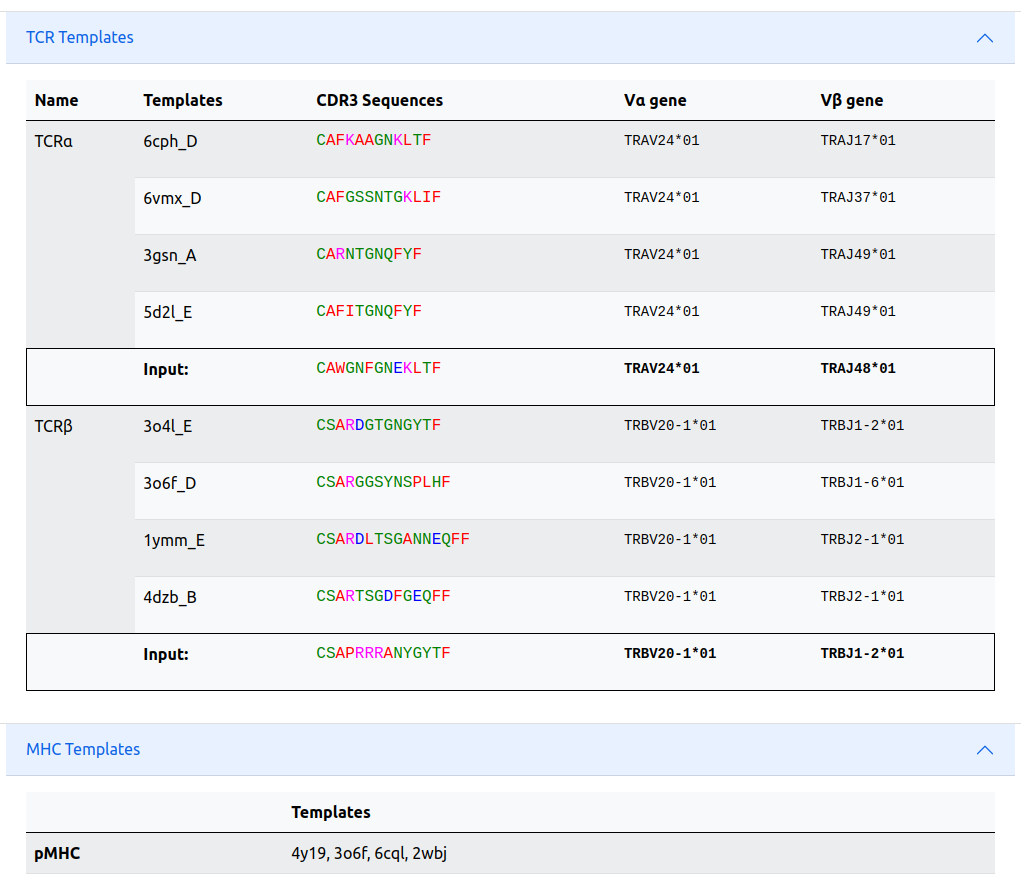
The expandable templates info tab shows the TCR templates with corresponding PDB (with chain IDs), CDR3 sequences and Vα and Vβ germlines used for the modeling. The CDR3 and V germlines of the input is also presented.
Docking and incident angles
If the output model presents an unusual TCR binding mode, a warning icon will appear on the right side of the model confidence together with a message informing the unusual binding mode to the user. To detect the unusual binding we estimate the docking and incident angles (see TCR3d help page for details) of each model and compare those angles with the ones of known TCR:pMHC structures. In a nonredundant dataset of 81 (MHC I) and 39 (MHC II) TCR:pMHC complexes, we found docking angles ranging from 16.1 to 127.8 and 25.5 to 136.9 and incident angles ranging from 1.3 to 48.8 and 0.7 to 43.2 for MHC I and MHC II, respectively. The docking and incident angles are also provided in the result JSON files.
All models viewer
Click "View all models" on the result page to view all five predictions in an interactive viewer port.